AIER · Data Centers & the Local Economy
built in R · simulated numbers

Is a data center a good deal for your county?

Short answer: say yes — it's a tax-base windfall with almost no service burden. The one thing to get right is the abatement, so your county keeps the upside. Each figure below is the output of the R shown.

The plant adds
+$5.0M
net county revenue per year — big tax base, few services
Smart terms let you keep
$149M
over 30 yrs by taxing the capital — vs. ~$50M under a 20-yr exemption
…and the abatement tips only
~12%
of decisions, so most of that upside is yours to keep
⚠ ILLUSTRATIVE — SIMULATED NUMBERS from transparent, labeled assumptions (one hyperscale campus: $1B investment, $600M assessed value, 0.9% county rate). Not a finding for any real county.  Project hub →
For a county commissioner, in one line:  Welcome the plant. Tax the capital. Cap or claw back the abatement — because the investment usually comes anyway.
Why R? Every chart here is generated by the code shown, from labeled assumptions and cited research. Change a number — the assessed value, the abatement length, the but-for rate — rerun one command, and the chart and the figure in the paper update together, with the source attached.
1 · The windfall

A data center pays in — and barely draws down

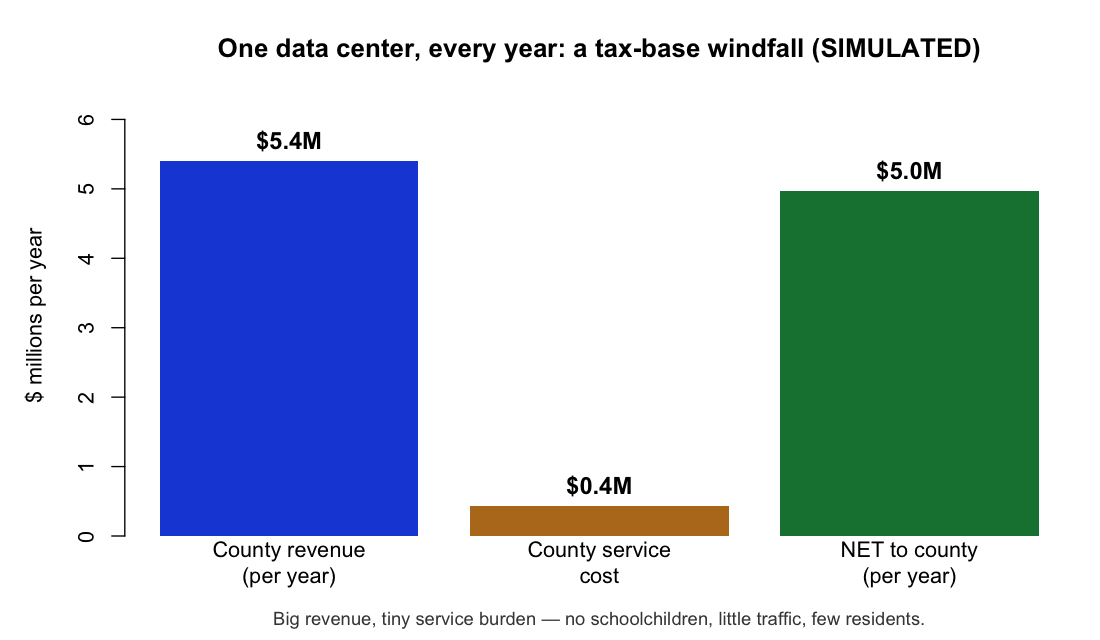
Unlike housing, a data center adds a large taxable asset with almost no demand for county services. In our illustrative campus that's ~$5.4M/yr in property tax against ~$0.4M of services — a net ~$5.0M/yr. (Loudoun County, VA: ~38% of general-fund revenue from ~4% of land, a decade of residential tax cuts.) The R that sets it up:

code/R/demos/demo_county_fiscal.RR
# SOURCE: county assessor + budget records (illustrative campus parameters)
assessed_val <- 0.60e9; tax_rate <- 0.009         # one hyperscale campus
gross_rev <- assessed_val * tax_rate              # ~$5.4M/yr to the county
net_rev   <- gross_rev - 0.08 * gross_rev         # ~$5.0M/yr after services
↓ the code above produces
County revenue $5.4M, services $0.4M, net $5.0M per year
One illustrative hyperscale campus, per year (simulated; Loudoun figures real).
Source: Loudoun County, VA budget records (real); per-campus parameters illustrative  ·  illustrative — assumptions logged in data/raw/SOURCES.md
2 · The decision

The abatement is what you actually vote on

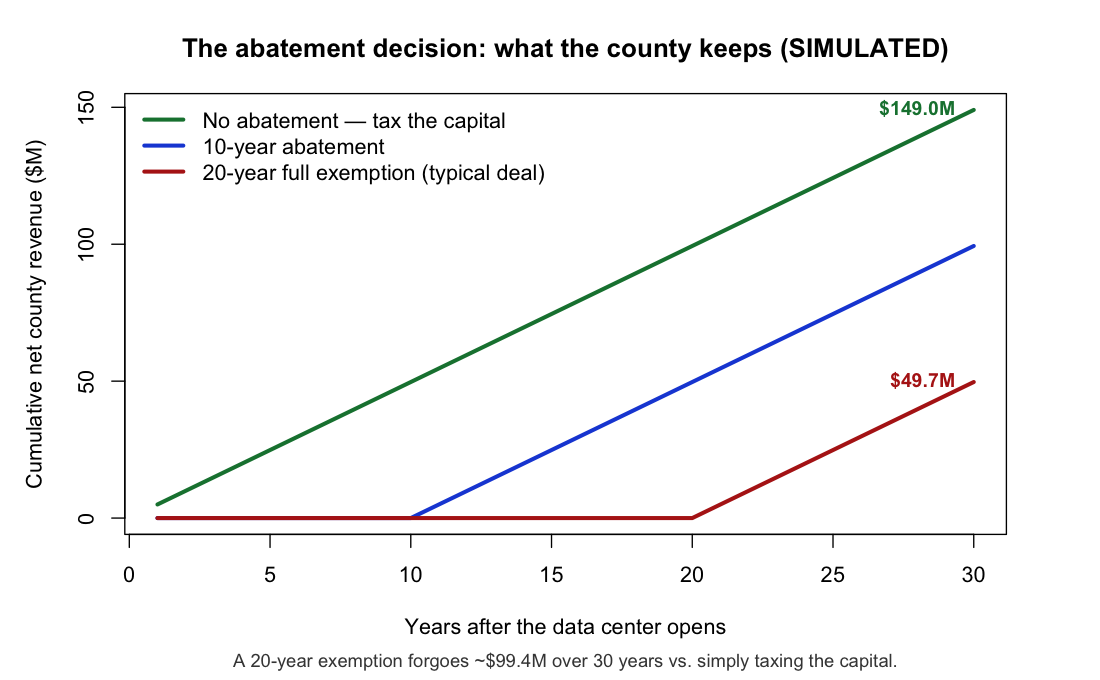
The plant is good for the county whether or not you abate its taxes — so the vote is really about the abatement. This is what the county keeps under each choice; the gap between the lines is money handed back. A six-line function generates all three scenarios:

code/R/demos/demo_county_fiscal.RR
# Cumulative net county revenue under an A-year property-tax abatement
cum_rev <- function(A) cumsum(ifelse(seq_len(30) <= A, 0, net_rev))
keep_taxed <- cum_rev(0)    # tax the capital from day one  ->  ~$149M
keep_20yr  <- cum_rev(20)   # 20-year full exemption        ->  ~$50M
↓ the code above produces
Cumulative net county revenue over 30 years: no abatement ~$149M, 10-year ~$99M, 20-year ~$50M
Cumulative net county revenue over 30 years (simulated). Tax the capital → ~$149M; 20-yr exemption → ~$50M.
Source: Illustrative scenarios on the campus parameters above  ·  illustrative — assumptions logged in data/raw/SOURCES.md
Is that ~$99M gap really "lost"? Only if the plant would have come anyway. That's the but-for question — and because data centers chase power, land, and fiber far more than tax deals, the research puts the but-for rate near ~12%. So for most projects the abatement changes nothing and the gap is upside left on the table. An argument for saying yes on better terms — not for saying no.
3 · The giveaway

Per local job, an open-ended exemption is hard to justify

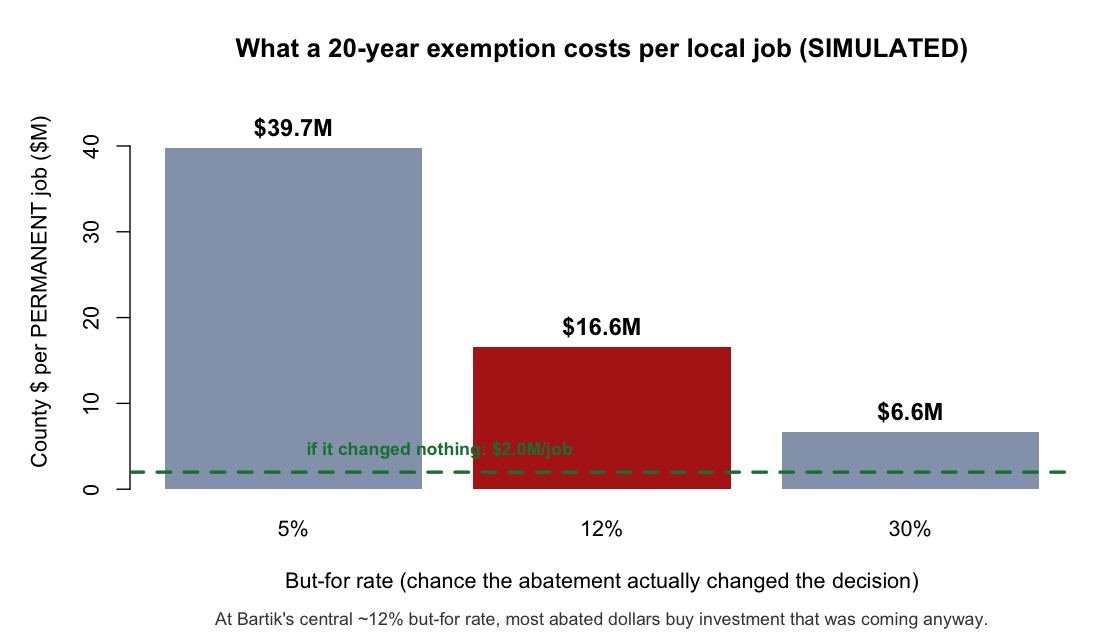
This isn't a knock on the data center — it's about the terms. Spread the abated revenue over the handful of permanent jobs and the price per job is steep, and steeper once you weight by the but-for rate. At Bartik's central ~12%, most abated dollars buy investment that was coming anyway:

code/R/demos/demo_county_fiscal.RR
# SOURCE: Bartik (2018) but-for rate ~12% — the share of decisions an incentive tips
forgone_20  <- net_rev * 20      # county $ given up over a 20-yr exemption
per_job     <- forgone_20 / 50   # only ~50 permanent on-site jobs  ->  ~$2.0M
per_induced <- per_job / 0.12    # per job the abatement actually caused -> ~$16.6M
↓ the code above produces
County dollars per permanent job under a 20-year exemption: $39.7M at 5%, $16.6M at 12%, $6.6M at 30%
County $ per permanent job under a 20-year exemption, by but-for rate (simulated).
Source: Bartik (2018), “But-For Percentages” (Upjohn WP 18-289)  ·  paper cite: \citep{bartik2018butfor}
4 · A caution

Don't bank on a “jobs boom” — bank on the tax base

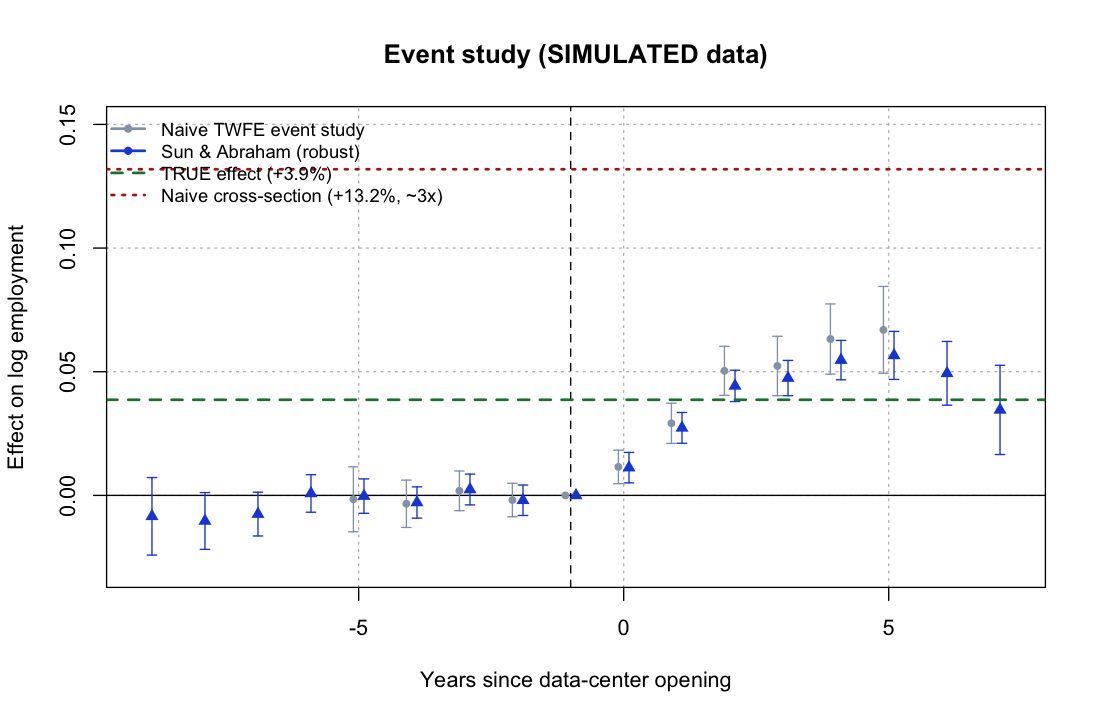
Boosters promise a wave of indirect jobs. Be careful: because data centers are sited in counties already growing, a naive before/after comparison overstates the employment effect ~3×. A proper event-study estimator in R strips that selection out and finds a real but modest effect. The bankable prize is the tax base.

code/R/demos/demo_event_study.RR
# Don't bank on a "local boom": does it survive a real estimator?
library(fixest)
naive  <- feols(log_emp ~ i(treated_ever), subset = year == 2023)  # +13.2%
robust <- feols(log_emp ~ sunab(cohort, year) | fips + year)       # +3.8% (true +3.9%)
↓ the code above produces
Event study: naive ~+13% vs robust ~+4% employment effect
Naive ~+13% vs. robust ~+4% employment effect (simulated).
Source: Bahar & Wright (Brookings 2026), synthetic control on ~770 facilities  ·  paper cite: \citep{baharwright2026}
Treated counties sit above never-treated before opening — selection
Why the naive number misleads: data-center counties were already higher before opening (simulated).
How this maps to the paper
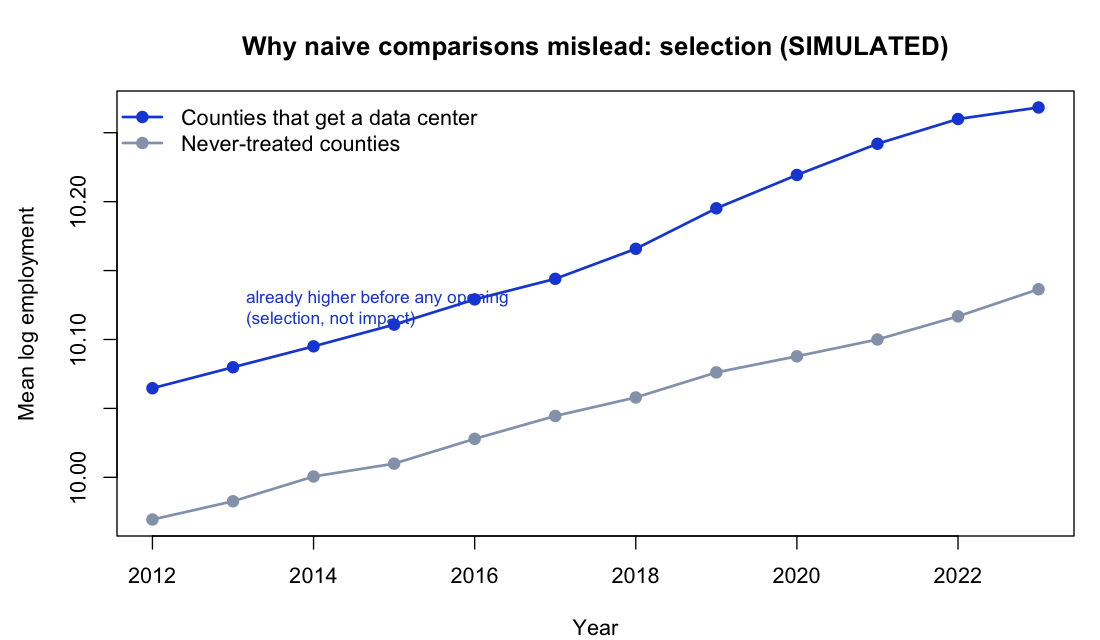
This is the paper's cost-benefit core in miniature: the investment (Ledger A — a low-service-burden tax base, vivid in the Loudoun case) vs. the firm-specific subsidy (Ledger B — mostly inframarginal at a ~12% but-for rate). The verdict — welcome the plants, question the abatements — and the cost-per-induced-job math come from §8–§9.  The economic case →  ·  Read the paper →
Reproduce it: Rscript code/R/demos/demo_county_fiscal.R and demo_event_study.R (base R; fixest for the event study). All numbers simulated from labeled assumptions for illustration only.  ·  Project hub · The paper