From a live source to a citable number in 8 lines
R pulls data straight from the agency that publishes it — so the number is reproducible and its source is unambiguous. Here it hits the BEA API for county GDP:
library(httr2); library(tidyverse)
# Pull county GDP straight from the BEA API — the source IS the data provider,
# so the number is reproducible and citable the moment it lands.
bea <- request("https://apps.bea.gov/api/data") |>
  req_url_query(UserID = Sys.getenv("BEA_KEY"), method = "GetData",
                datasetname = "Regional", TableName = "CAGDP2",
                GeoFips = "COUNTY", Year = "2023", LineCode = 1) |>
  req_perform() |> resp_body_json()
# -> county GDP for every U.S. county, sourced to BEA Regional Accounts,
#    ready to clean, plot, and cite. (full version: code/R/03_bea_income_gdp.R)
That same pattern — fetch from a named source, clean, compute, plot — produces everything below. Each chart is preceded by the exact R that makes it, and followed by the source it cites in the paper.
The best land use for the county budget
Every land use generates revenue but also demands services. The Cost of Community Services literature finds new housing typically costs a locality about $1.16 in services per $1 of taxes it pays, commercial/industrial about $0.29 — and a data center, with no schoolchildren and few residents, almost nothing. A few lines of R turn those ratios into the net the county keeps:
# SOURCE: Cost of Community Services medians (American Farmland Trust, 150+ studies)
cocs_cost <- c("New housing" = 1.16, "Commercial/industrial" = 0.29, "Data center" = 0.08)
net <- 1 - cocs_cost      # net county $ kept per $1 of revenue raised
#   New housing -0.16  |  Commercial/industrial +0.71  |  Data center +0.92
barplot(net)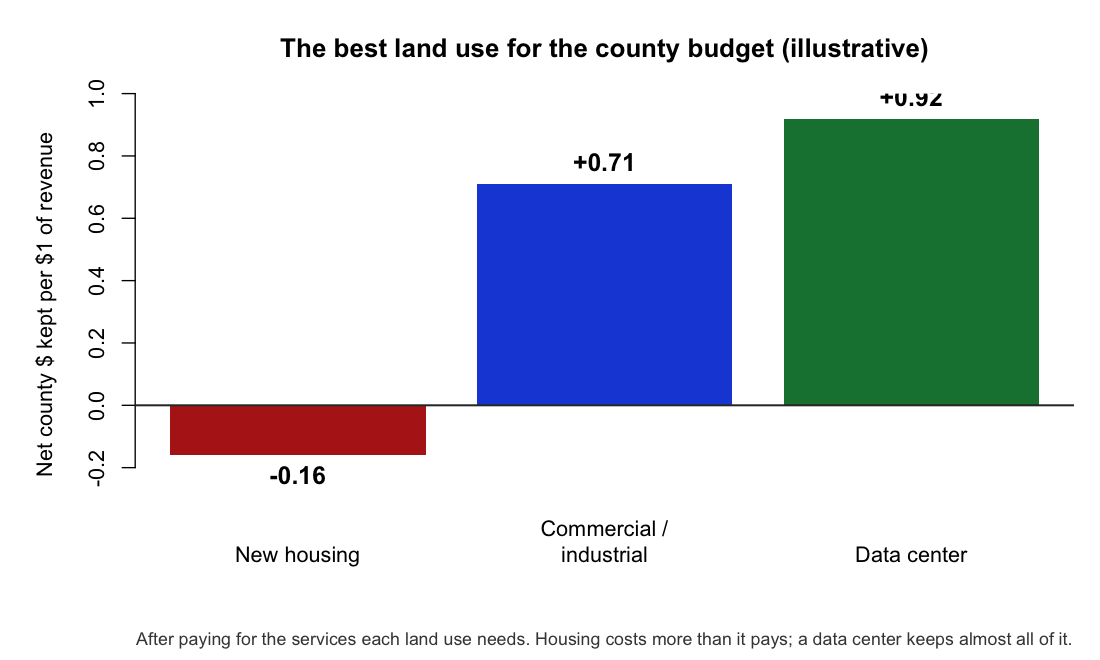
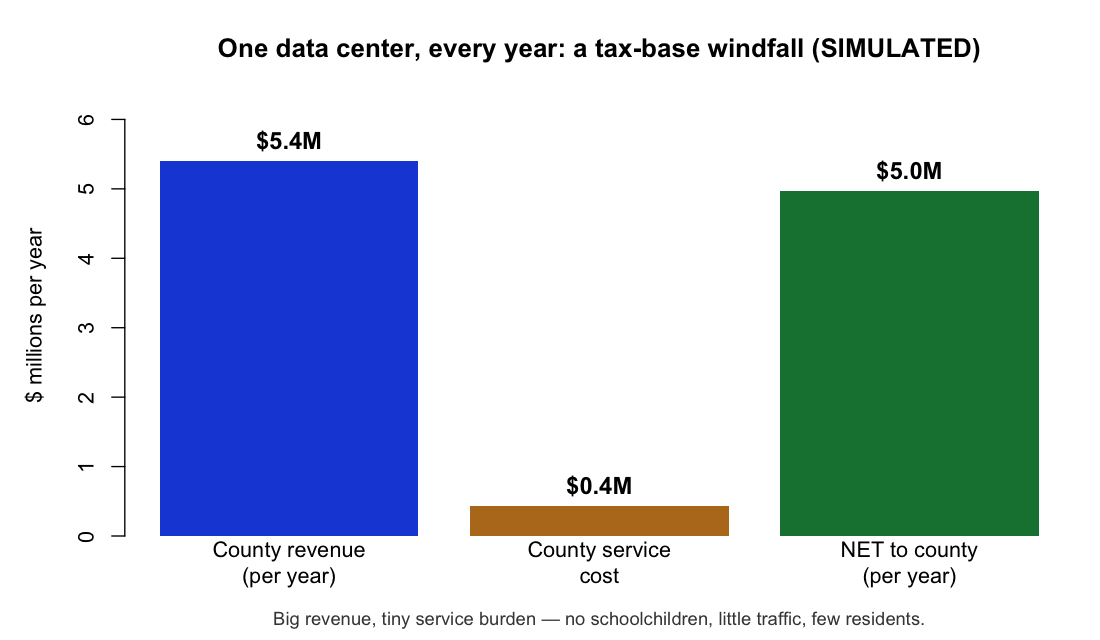
data/raw/SOURCES.mdIt funds services without new residents to serve
For one illustrative hyperscale campus: ~$5.4M/yr in county property tax, ~$0.4M of added services, a net ~$5.0M/yr. The real proof is Loudoun County, VA: data centers throw off ~38% of general-fund revenue from ~4% of land, cutting the residential tax rate from $1.145 to $0.805 per $100 — every year for a decade.
# SOURCE: county assessor + budget records (illustrative campus parameters)
assessed_val <- 0.60e9; tax_rate <- 0.009          # one hyperscale campus
gross_rev <- assessed_val * tax_rate               # ~$5.4M/yr to the county
net_rev   <- gross_rev - 0.08 * gross_rev          # ~$5.0M/yr after services
data/raw/SOURCES.mdMassive private capital, when little else is building
A single hyperscale campus is roughly $1B of private investment. U.S. data-center construction ran near a $41B annual rate in 2025, up ~32% YoY, while total construction fell ~1.4% — capital deepening the county captures at zero public capital cost, anchoring the cloud-and-AI build-out (~$5.2T for AI alone by 2030, 40%+ U.S.).
# SOURCE: U.S. Census Bureau, Value of Construction Put in Place (C30), 2025
chg <- c("Data-center construction" = 32, "All U.S. construction" = -1.4)  # YoY %
barplot(chg)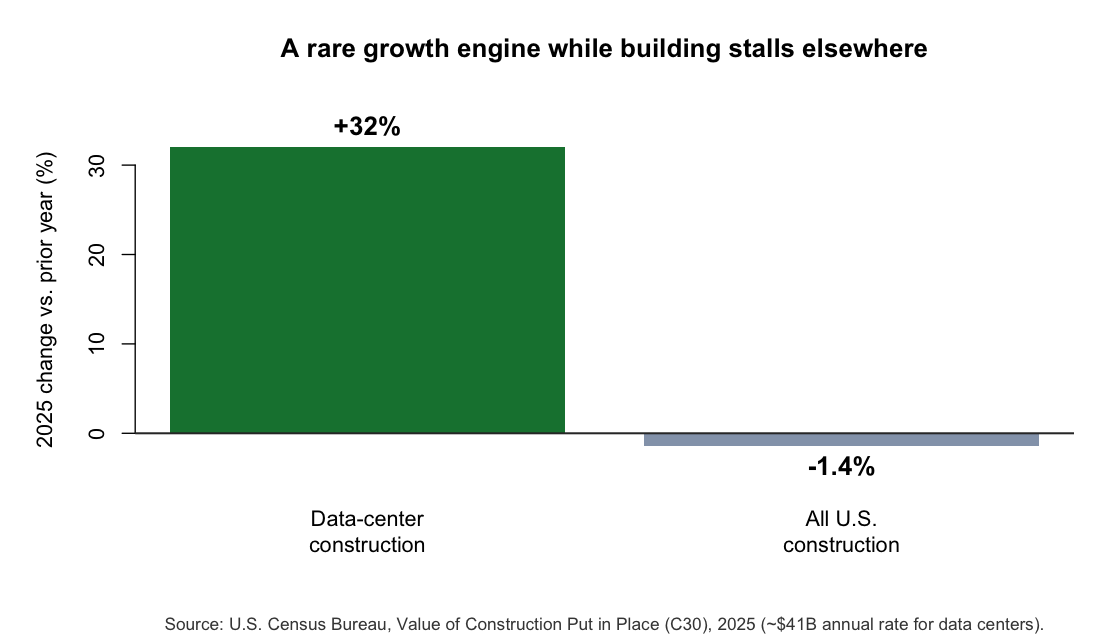
data/raw/SOURCES.mdNot just construction — durable local employment
The honest, rigorously estimated effect is positive: a county's first data center raises local private employment ~4–5% and wages 3–4%; clusters of four or more see information-sector jobs jump ~23%. These are synthetic-control estimates, which strip out the siting selection that inflates naive comparisons (and show no significant home-price effect).
# SOURCE: Bahar & Wright (Brookings 2026), synthetic control on ~770 facilities
jobs <- c("First data center (private emp)" = 4.5,
          "Clusters of 4+ (information sector)" = 23)
barplot(jobs)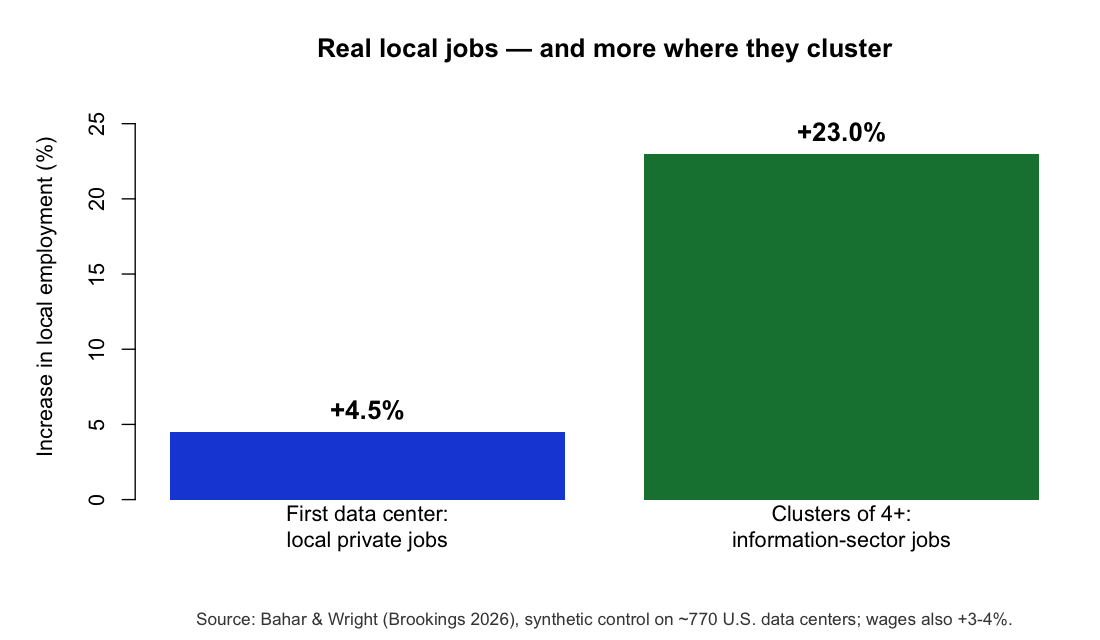
\citep{baharwright2026}From R straight into the paper, with a citation
Because each result carries its source, dropping it into the manuscript is mechanical — a value, a \citep{}, and the matching entry already in paper/references.bib (40 verified sources). Nothing is hand-typed or unsourced.
# How a coded result becomes a CITED sentence in the paper:
emp <- 0.045   # value from the analysis
#  paper/ (LaTeX):  "...raises local employment about 4--5\% \citep{baharwright2026}."
#  paper/references.bib:
#    @techreport{baharwright2026,
#      author = {Bahar, Dany and Wright, Greg}, year = {2026},
#      title = {The Local Economic Effects of Data Center Entry}, ... }
The cited facts behind the case
Rscript code/R/demos/demo_pro_case.R.The investment is the win — the policy question is how to structure the incentive so the county keeps the upside. That's the paper's "welcome the plants, question the abatements" point. The abatement decision tool → · Read the paper →
code/R/demos/, base R) from cited public data. · Project hub · The paper